scale_x_weeknumber() and scale_y_weeknumber() create continuous ggplot2
position scales for weeknumber data on the x and y axes.
Usage
scale_x_weeknumber(
  name = ggplot2::waiver(),
  breaks = ggplot2::waiver(),
  minor_breaks = ggplot2::waiver(),
  n.breaks = NULL,
  labels = ggplot2::waiver(),
  limits = NULL,
  expand = ggplot2::waiver(),
  oob = scales::censor,
  na.value = NA_real_,
  guide = ggplot2::waiver(),
  position = "bottom",
  sec.axis = ggplot2::waiver()
)

scale_y_weeknumber(
  name = ggplot2::waiver(),
  breaks = ggplot2::waiver(),
  minor_breaks = ggplot2::waiver(),
  n.breaks = NULL,
  labels = ggplot2::waiver(),
  limits = NULL,
  expand = ggplot2::waiver(),
  oob = scales::censor,
  na.value = NA_real_,
  guide = ggplot2::waiver(),
  position = "left",
  sec.axis = ggplot2::waiver()
)
Arguments
- name, breaks, minor_breaks, labels, limits, expand, oob, na.value, guide, position, sec.axis
Passed on to
ggplot2::scale_x_continuous()orggplot2::scale_y_continuous(). See those functions for details.- n.breaks
Approximate number of major breaks. The default break algorithm treats this as a target and may return a nearby number to retain regular or calendar-aligned spacing.
Details
These helpers use the package's weeknumber transformation so ggplot2 can
plot weeknumber vectors directly and format axis labels as ISO year-week
values.
When breaks is left at its default, the scale chooses a regular weekly or
calendar-aligned interval that is close to n.breaks. Candidate intervals
include 1, 2, 4, 8, 13, and 26 weeks; quarter, half-year, and year starts; and
sensible multi-year intervals. Calendar-aligned breaks are preferred when
candidates are equally close to the requested number. Consequently,
n.breaks is a target rather than a guarantee.
Supply breaks or labels to override the defaults in the same way as for
ggplot2::scale_x_continuous(). Default breaks are whole weeks within the
displayed limits, including any expansion added by ggplot2.
Examples
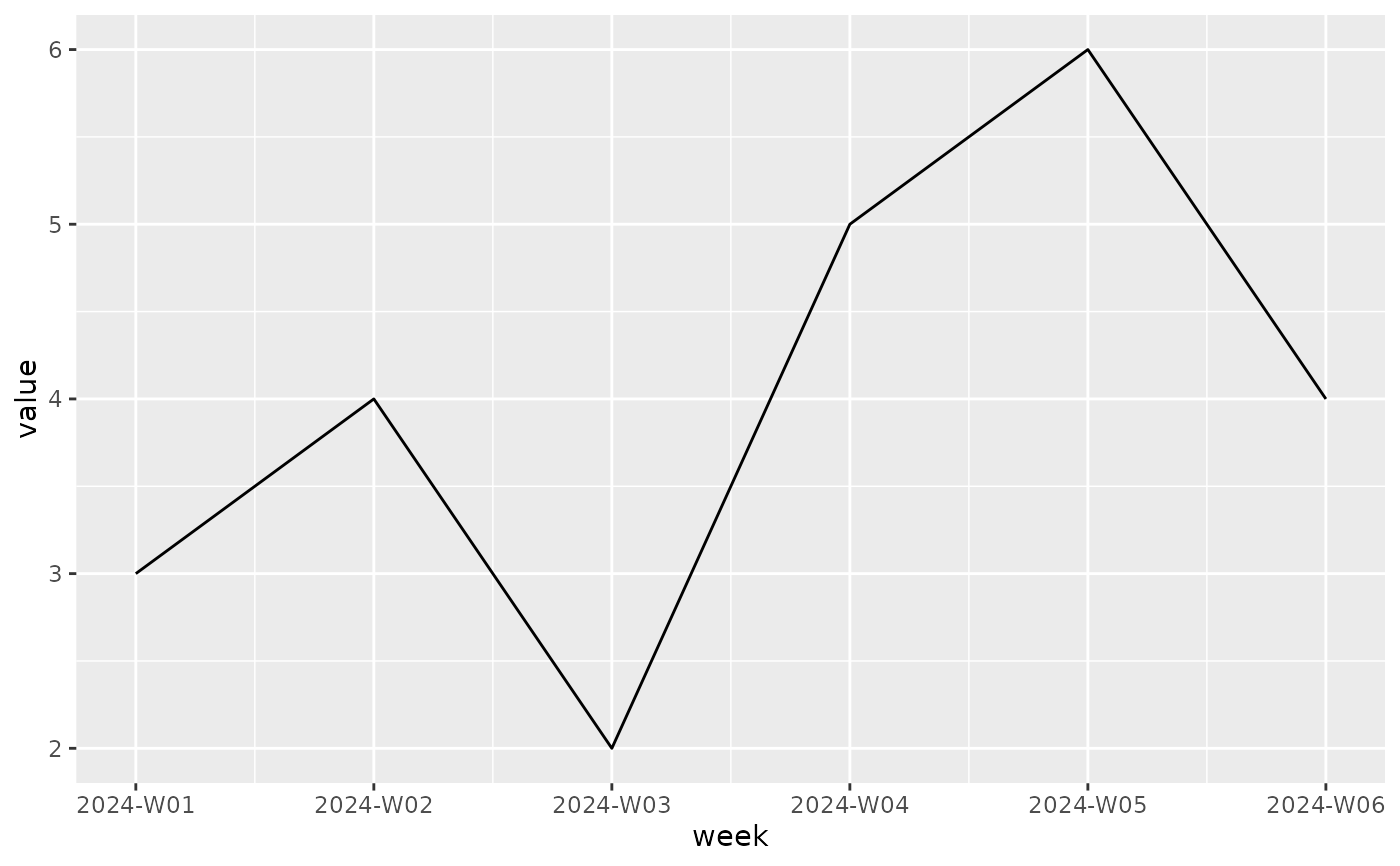
df <- data.frame(
week = make_weeknumber(2024, 1:6),
value = c(3, 4, 2, 5, 6, 4)
)
ggplot2::ggplot(df, ggplot2::aes(week, value)) +
ggplot2::geom_line() +
scale_x_weeknumber()
 # Request fewer major breaks while retaining calendar-aware spacing.
ggplot2::ggplot(df, ggplot2::aes(week, value)) +
ggplot2::geom_line() +
scale_x_weeknumber(n.breaks = 3)
# Request fewer major breaks while retaining calendar-aware spacing.
ggplot2::ggplot(df, ggplot2::aes(week, value)) +
ggplot2::geom_line() +
scale_x_weeknumber(n.breaks = 3)
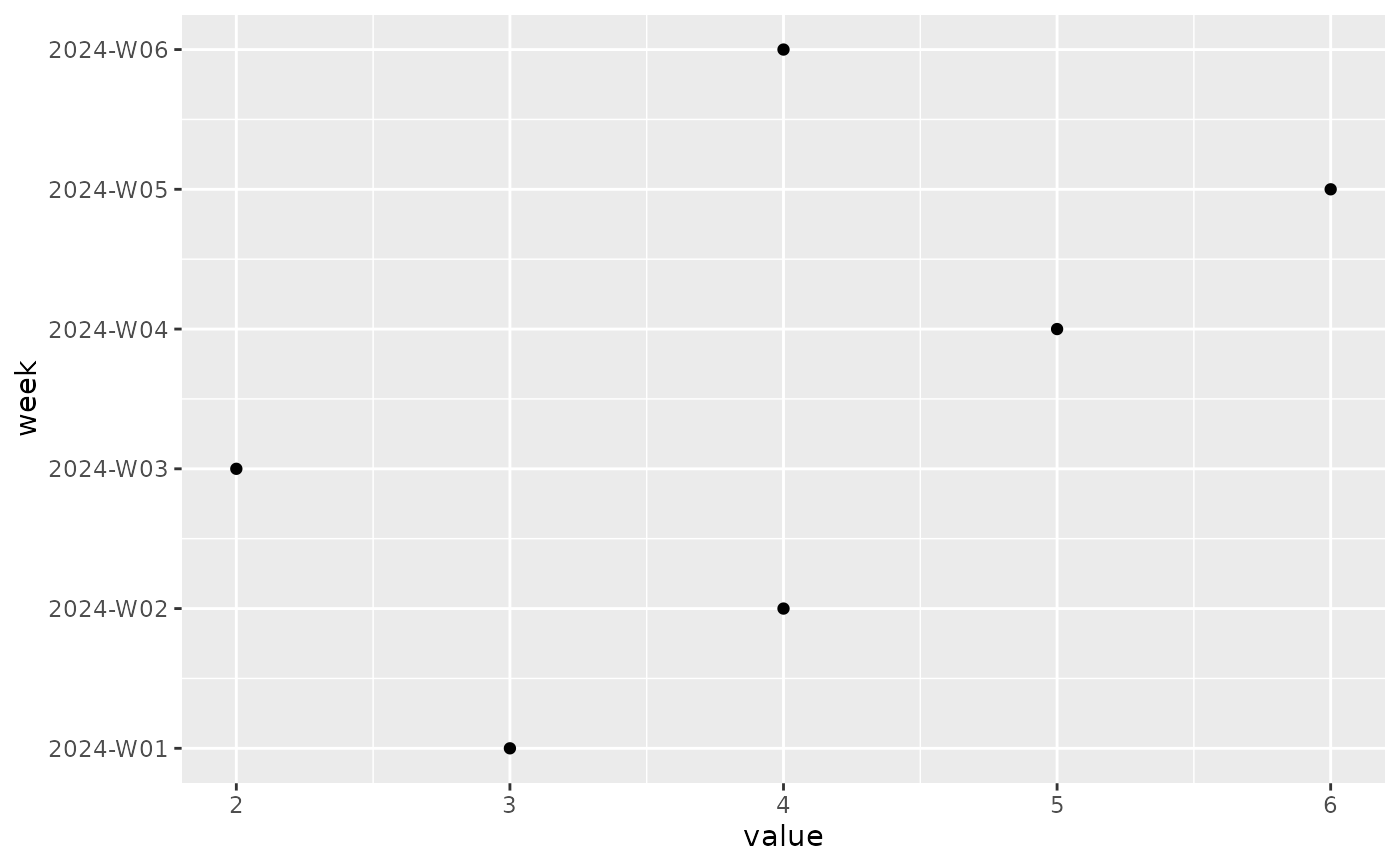
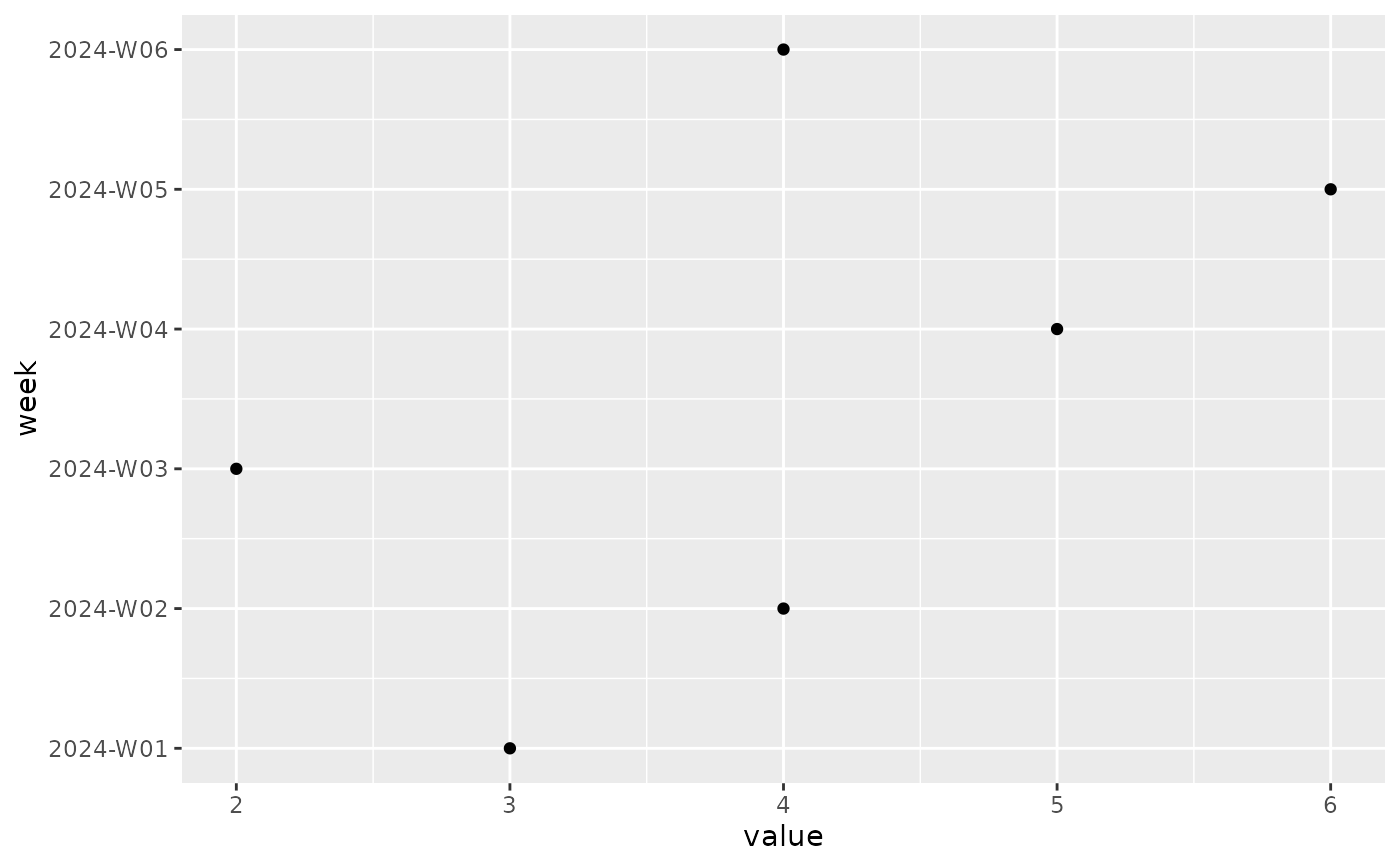 ggplot2::ggplot(df, ggplot2::aes(value, week)) +
ggplot2::geom_point() +
scale_y_weeknumber()
ggplot2::ggplot(df, ggplot2::aes(value, week)) +
ggplot2::geom_point() +
scale_y_weeknumber()